
Photometry
What is photometry?
Photometry is the science of measuring the amount of light received from a star. The word comes from the Greek 'photo' meaning light and 'metron' to measure. Photometry measures the flux of the star. This is the amount of energy from the star that has reached us. The units of flux are Watts per square metre (W/m2)
Photometry is often used together with called spectroscopy. This technique splits light into its different wavelengths. Measuring the amount of light an object emits at various wavelengths can also help us to understand its other properties. Things like its temperature, size, mass, and how much light it is emitting (luminosity).
Credit: The Universe in the Classroom
Light-curves
Photometry is good for looking for changes in flux. We can observe changes in flux over hours, days or months and plot a graph of how the brightness of the object changes with time. These graphs are called light-curves.
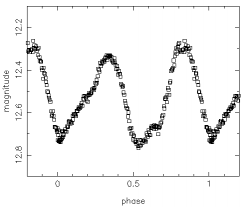
If the flux of light from a star appears to change over time, it is called a variable star. An important type of variable star is the Cepheid Variable. The light-curves of these stars show regular peaks and dips. The time period of each cycle is linked to the luminosity of the star. The luminosity of a star can be used to work out how far away it is.
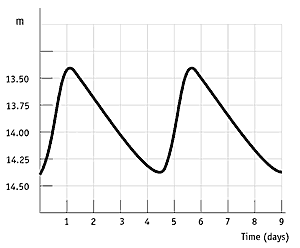
Star systems that contain 2 stars are called binaries. If both stars orbit in a plane that lies up with our view, each star will repeatedly pass in front of the other. This eclipse produces a pattern of dips in the light-curve. So light-curves can help us find these systems, as well as learn more about them. The data can be used to work out the relative sizes, masses and densities of the 2 stars. The same technique is used to hunt for exoplanets.
Credit: Department of Physics, Durham University
Light-curves can also help us to learn more about supernovae. Following a supernova explosion, the flux of a star will rapidly rise and then slowly fade away. The shape of the light-curve can be used to categorise supernovae.
Closer to home, light-curves can be used to study asteroids. If an asteroid shows a repeated pattern of brightening and dimming it is probably rotating. The variation is due to changes in the amount of sunlight reflected by the asteroid as it tumbles. By looking at its light-curve, it is possible to work out how fast an asteroid is spinning.
Using software
Astronomical data must be processed using a piece of software. Most software packages contain options for you to do photometry. In the software, we can measure the brightness of different objects in the image. The value we measure is the intensity or 'counts'. This can be thought of as the number of photons collected by the telescope. However, it is more accurate to say it is a measurement from the CCD of the number of electrons dislodged by the photons hitting it.
From looking at the sky at night, you may assume that each star is a distinct point of light. However, if you use a telescope to look at a star, you will notice that the light is not a single point; it has been smeared into a disc. This effect is due to the Earth’s atmosphere. The worse the atmospheric conditions, the bigger this disc becomes. We can actually measure how good or bad the effect of the air is. We call this value, the ‘seeing’. So if we want to measure the amount of light received from the star, we need to account for the smearing to make sure we add up all the light.
Credit: Fraser Lewis
To do this we measure counts across a circle, (known as an aperture) rather than measuring the counts at a single point. We must calculate a suitable radius for the size of the aperture. If this value is too low, we will not include all the light being collected by the telescope. If this value is too high, we might include light from other nearby objects not related to the star. This may be a problem when studying objects in a densely populated area of the sky – like a star cluster.
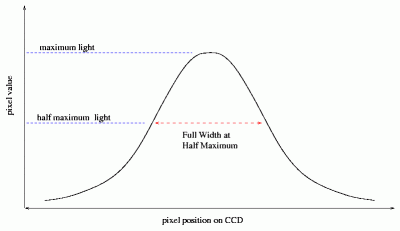
In an astronomical image, the photons collected from point sources such as stars will follow a distribution of a particular shape known as a Gaussian curve. From this curve, a value known as the Full Width Half Maximum can be calculated. This gives us the best aperture size to select for our analysis. Some software will calculate this value for you. However, you can also work it out and set this value yourself.
Credit: Michael Richmond, Rochester Institute of Technology
You should draw the annulus around your star to include all of the visible object, with some sky around it. The sky around your object will contain light as well. Everywhere in space, there will be some background light which has been scattered off other objects and things around you. This gives us a background, or sky brightness, measurement. We measure this in photometry in a ring around the target object. This ring is known as a sky annulus. It calculates the sky brightness local to your object and then takes this brightness away from your target to give you the true counts of your object alone. Generally, this annulus should be in the same position - unless there are any bright objects which fall within it. The sky annulus, or sky ring, should just contain 'empty' space.
Once a value is chosen for your apertures, it is important to use the same radius for all images in a dataset. For example, if you are studying the same star cluster in two different filters (e.g., B and V), then you should use the same radius for both images. This makes sure that you are comparing 'like with like'. You should also use the same size radius if you are measuring the same object over time to create a light-curve.